Mistakes in science
Published:
tl;dr version of this post
- Almost all published science has mistakes in it.
- Even in the big data world, it’s important to work with people who have “been there” and know where the data come from.
- The best mistakes are the ones that are also opportunities (but not all of them are)!
First of all I apologize for the long silence in between blog posts. I have a lot of different topics I’m planning to blog about in the near future. Since I last wrote a blog entry, we’ve welcomed a new arrival to our family, a baby boy born on July 3. As you can imagine, blogging has slipped through the cracks a little bit. I hope a few more will follow after this.
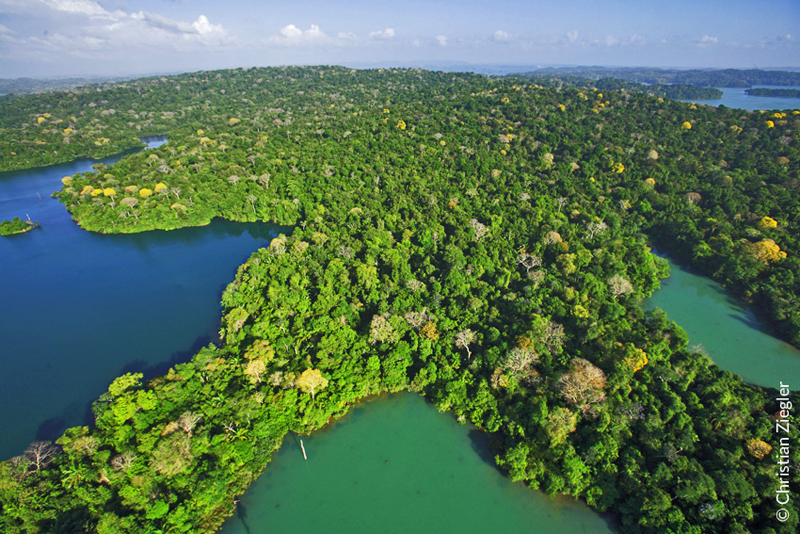
Along with a fellow postdoc, I have been working on a project investigating patterns of how rainforest trees divide up light energy. I am not the first author but I’ve been working on the data processing, analysis, and statistics for the project for about 3 years now. I’ll give a brief idea of what the paper is about: Trees are constantly struggling to get as much light as they can to fuel photosynthesis. The more light energy they get, the taller they can grow and the more light they can deny their neighbors. Eventually, if a tree has enough light energy, it invests some of it into producing flowers, fruit, and seeds, and ultimately offspring. So it’s clear that in places where other resources like water and soil nutrients are adequate, the species of trees that get the most light are going to be the ones that become the most abundant.
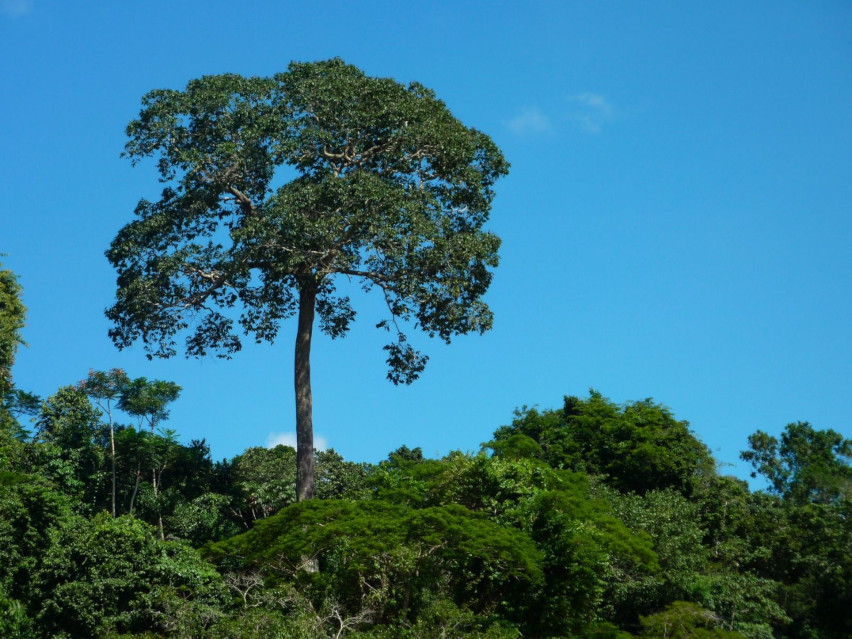
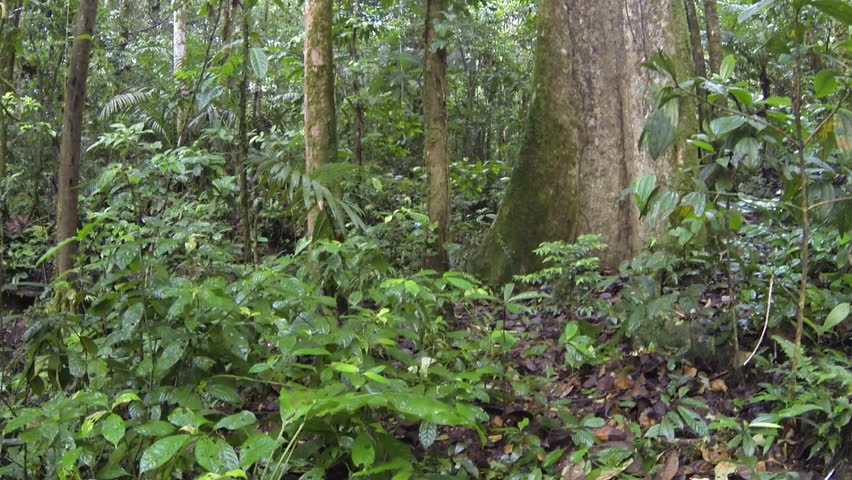
The picture is a little more complex than that, though. There are actually a number of different “life strategies” a tree can pursue that are good enough, in an evolutionary sense, for species with those strategies to survive and prosper. There are some kinds of trees that grow extremely quickly in light gaps created when large trees are felled by things like lightning or windstorms. However, the breakneck pace those trees grow comes at a cost: they die at relatively young ages and cannot survive at all in dimmer, shadier spots. In contrast, other species of trees can survive for a long time in dim, shady places, but this conservative lifestyle means that their growth maxes out at a relatively slow rate. As a third strategy, there are also trees that are intermediate in their growth rate and survival rate but can grow to immense sizes – these end up being the “canopy giants” of the rainforest in Panama that we are studying. However, those giants cannot produce any offspring until they are quite large. The fourth strategy is the opposite pole to the giants: trees that grow only to a short, shrublike size but can produce lots of seeds and offspring while they are still relatively small.
The paper we’re writing tells a complete story that links these different tree life strategies with broad ecological theories that explain how organisms’ growth rates and energy consumption rates scale with size. We explain how energy is divided evenly among size classes of trees in the rainforest, even though it would seem like big trees should hog all the light. I’m excited about this paper but I don’t want to give too many more spoilers. What I really wanted to write about here is a mistake we found in the analysis, and the consequences of it.
About a week ago, one of the co-authors on the paper, who has done a lot of work with tropical trees and who is very familiar with the system, noticed that some of our graphs looked weird. After delving into the problem, we realized that due to some errors in data processing, we had excluded a large number of small sapling trees from the dataset. That exclusion had caused a bizarre-looking pattern where there were fewer small trees than expected from the scaling relationship we fit. We had come up with various explanations for the anomaly, not to mention Frankensteining together a piecewise statistical distribution that would fit the funny-shaped curve caused by the anomaly. Imagine our surprise when we realized that we had simply been leaving out a large portion of the data throughout three years of analysis!
After smacking my head on the desk for a minute or two and bemoaning my stupidity, I moved on to fix the mistake. I am happy that we discovered the mistake. Here are a few lessons I’m taking away from it:
All science has mistakes. It’s likely that if we had published our findings earlier, that error would have made it into the final version of the article (if it wasn’t detected by an eagle-eyed reviewer). I am sure that almost all my other scientific research, and probably any other research that is sufficiently complex, has some kind of mistake in it, whether large or small. Anything that is exploring new dimensions of knowledge and trying out new ways of understanding the world is almost by definition more prone to errors — but that is exactly what is so exciting about it.
Show your data to someone who’s been there. Second, the fact that someone who had a lot of experience studying tropical rainforests on the ground discovered the mistake is no coincidence. That made me realize once again that even though analyzing data is great, and the skill set needed to work with big ecological datasets is essential these days, we can’t discount the expertise gained by working in the field. It’s a recipe for disaster to have a team composed only of theorists and data analysts without including people that have “been there” and can quickly and intuitively notice things that don’t look right when you plot the data.
Mistakes in science are, or at least should be, opportunities. Finally, getting rid of the mistake greatly simplifies the “story” of the paper — we can now eliminate the ad hoc explanations for the anomaly, and we can get rid of the jury-rigged stats we had to use to fit the data before. Also, we are using this opportunity to add new data to our analysis: previously we had assumed that the relationship between tree diameter and tree crown size was the same for all species, but now we can add in species-level relationships. We hadn’t done that before because I didn’t feel like rerunning all the models to make that change. Now that we have to rerun everything anyway, it’s a good chance to make a lot of improvements. Also, the fact that we thought there was an anomaly for so long caused me to learn a lot of additional statistics that will benefit my future research.
Thanks to Tom for inspiring me to write this post.
Leave a Comment