I had a great time at the conference. I liked the size and enthusiasm of the crowd, which was probably at most 60 or 70 people with a lot of students and postdocs. Clearly the conference organizers knew each other from way back — they made lots of corny jokes about how everyone was getting old and reminisced about line dancing through the years. It was wonderful to get to meet my ARS statistician colleague Kathy in person, and to see my old friend Andy Finley from my time at Michigan State. The conference was held in a building in the middle of a cornfield at Purdue’s ag experiment station a few miles away from the campus, which definitely set the tone.
I won’t mention every talk here, but I took notes on a few of them that I was especially excited about. The key themes that really piqued my interest were geospatial statistics, Bayesian approaches, stats education, and stats for long-term breeding trials.
Spatial stats: Andy Finley’s presentation on using nearest neighbor Gaussian process models with spatial data was very interesting. I had seen a similar talk back at MSU but it was a good reminder that it might be a useful approach for some of the datasets our scientists are working with. He compared and contrasted his method with the INLA approach and the reduced-rank approach, demonstrating that the nearest neighbor approach does much better in terms of approximating the full spatial model while remaining computationally feasible. Some of it is implemented in R packages called spBayes, spNNGP, and spOccupancy. But it turns out that for complicated real-world use cases like the one he presented using Forest Service FIA data, you can’t really use an off-the-shelf package. I think he coded everything in C. So that’s a bit of a steep barrier to entry. Predicting over spatial fields came up in other talks throughout the conference. For example Eryn Blagg (PhD student from Iowa State) talked about various approximated kriging approaches. That also gave me some ideas for things to look into later.
Stats ed: Sarah Manski, a PhD student from Michigan State, gave a talk on teaching a Bayesian stats and R workshop to Ethiopian ag scientists. Her short tutorial “You Can Learn R” might be a useful resource. It doesn’t teach R directly but aims to help beginners figure out what they should do if they want to learn R. A lot of ARS scientists would find it helpful!
Breeding trials: Another talk I found interesting was one given by Marcia Almeida de Macedo from Syngenta. She is working with some of their long-term breeding trial data, using it to do bootstrap simulations to figure out what is the optimal number of checks to include in a trial, and how many years checks and test varieties should be included before being gradually replaced. This was very interesting to me because some SEA scientists have similar long-term datasets that could be used in this way. Unfortunately she couldn’t give too many specifics because they’re guarding their trade secrets.
Cross-validation: Finally, I liked Rob Tempelman (also Michigan State)’s talk on blocked or grouped cross-validation. If you have a multilevel model, you have to think carefully about what level you want to do the cross-validation or out-of-sample predictions. You can get falsely optimistic results if you don’t do it correctly. This would be the case for block designed studies as well as anything with spatial or temporal dependence. A 2017 paper in Ecography by Roberts et al. is a useful reference. I also learned about the R function groupkfold() in the caret package which is a nice way to do that kind of cross-validation.
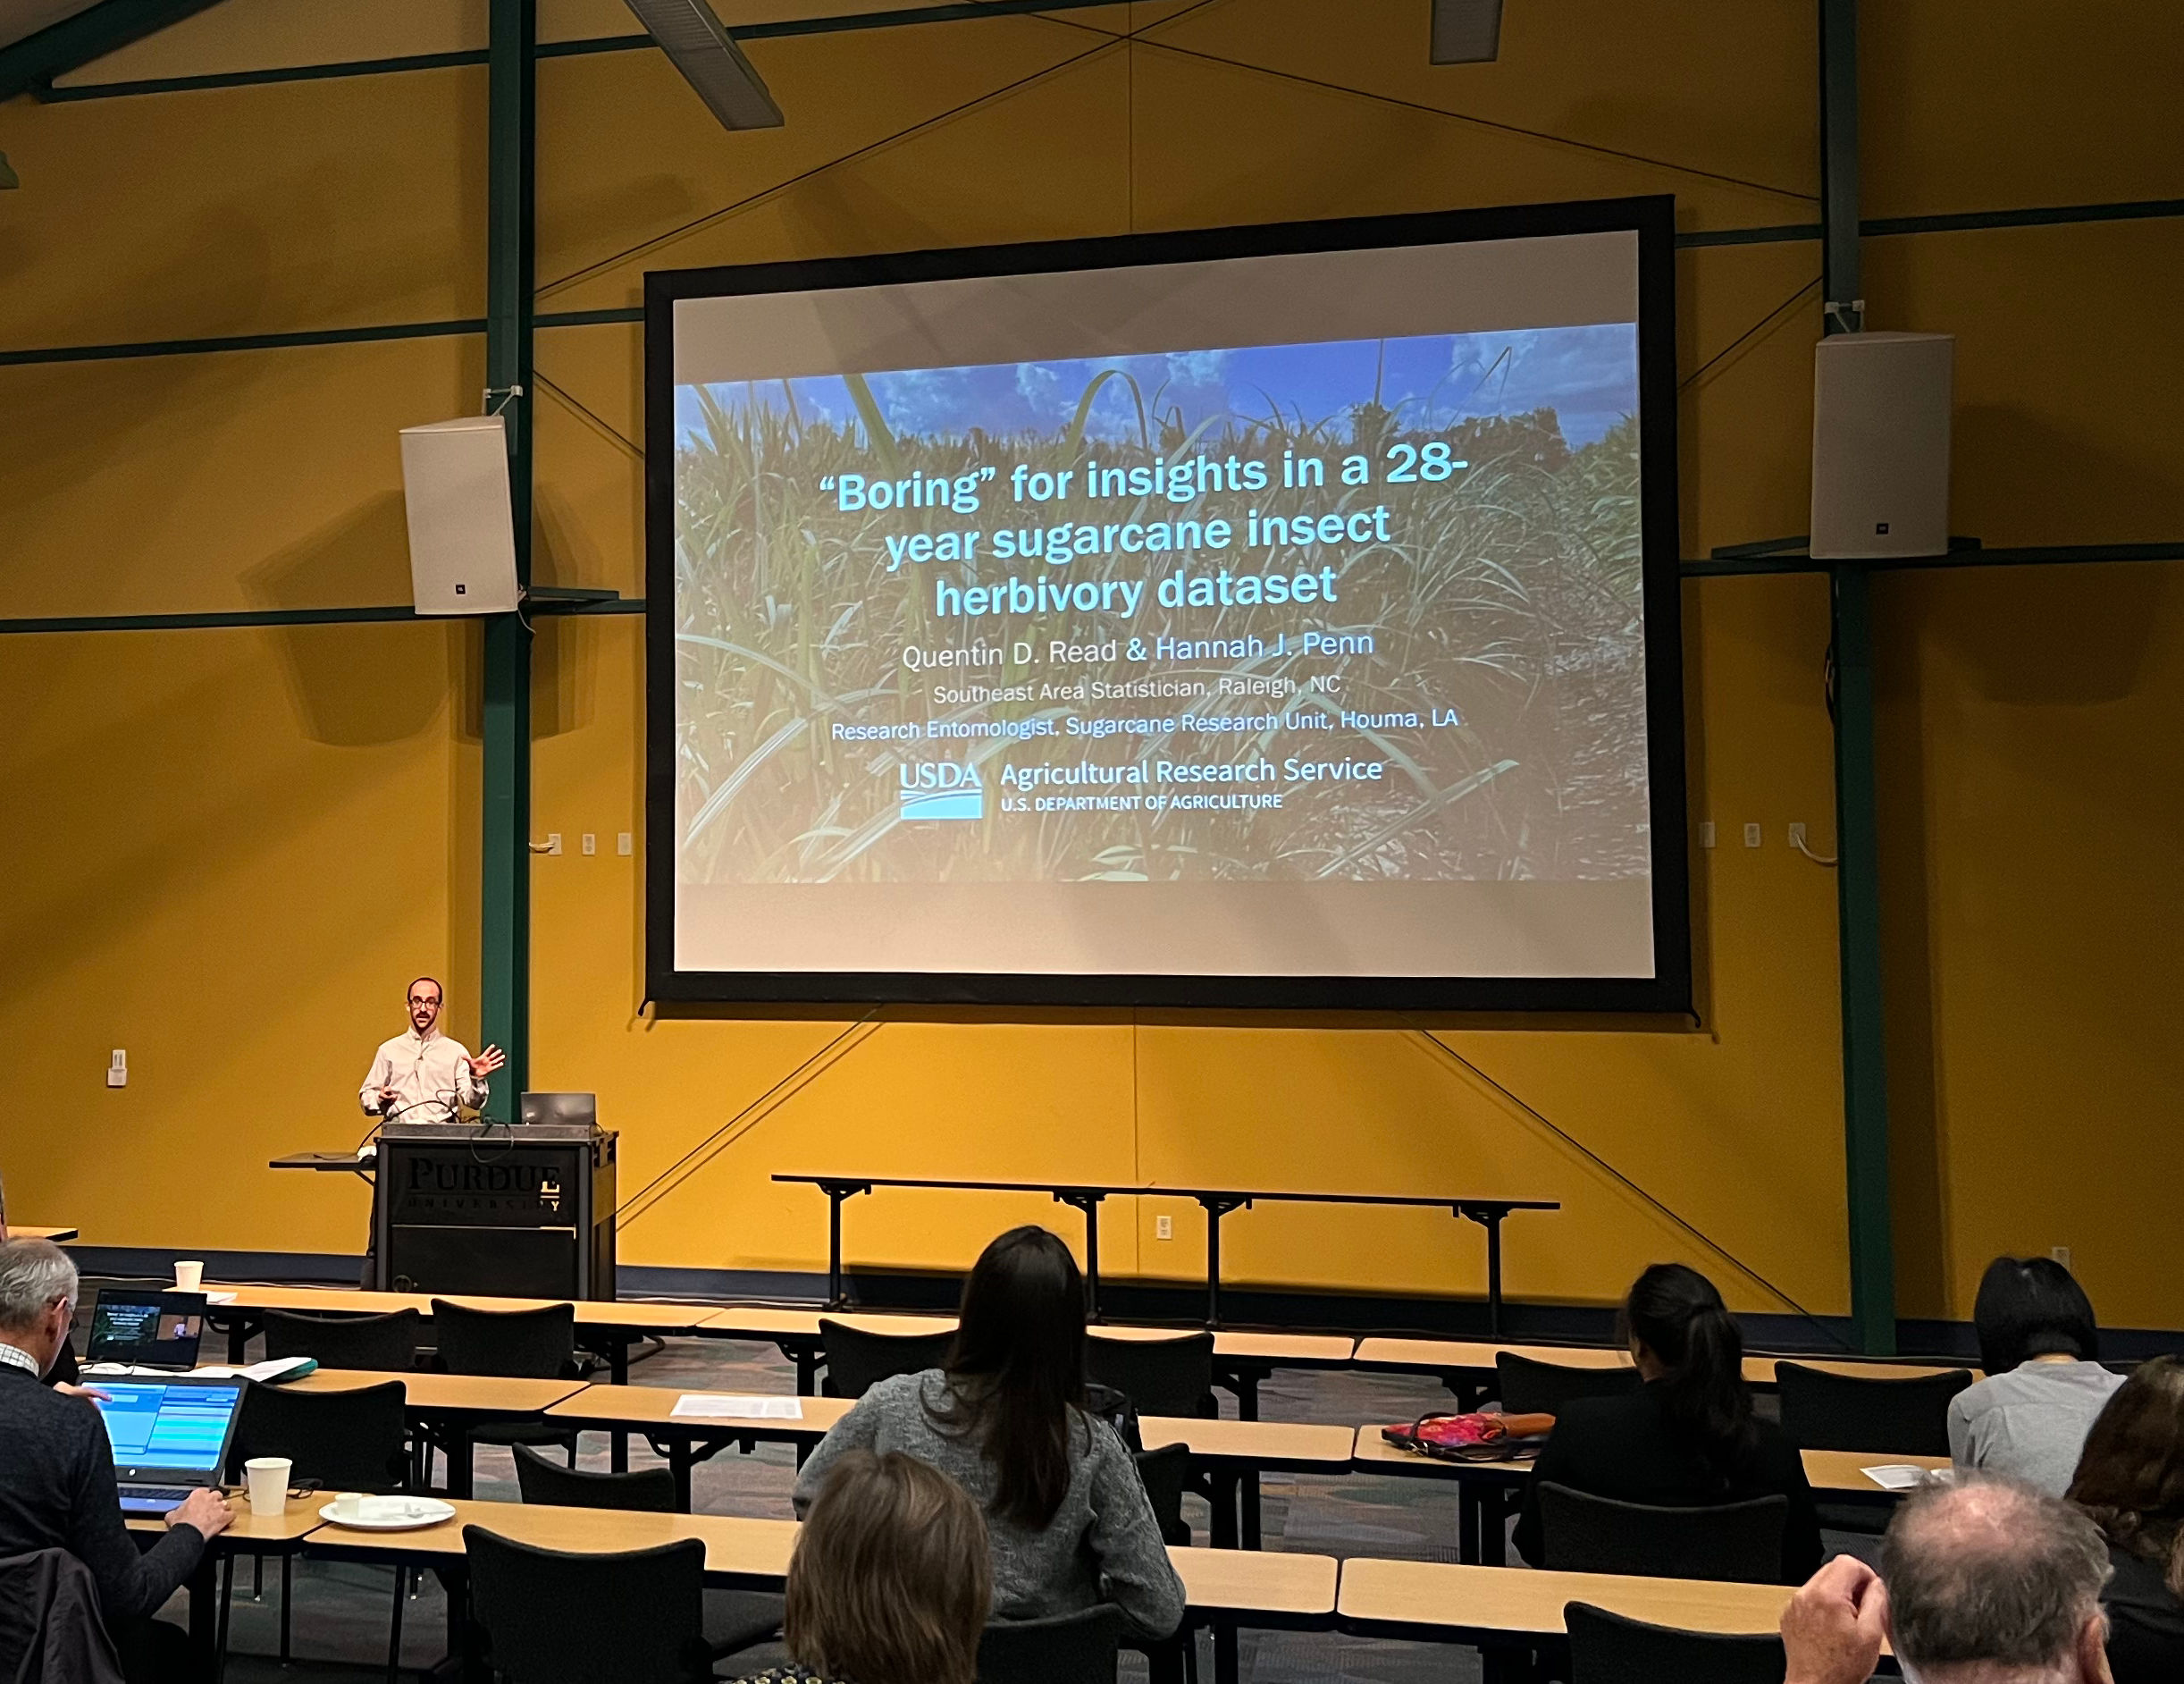
My own talk was about a dataset I am working on with an ARS scientist. I got some very good peer review from the statisticians and figured out a lot of things that I could improve about the model. It was intimidating to present my stat model to the likes of Hans-Peter Piepho, but he did not disappoint, making several points that directly led to changes I need to make. I am currently working on getting those changes done!
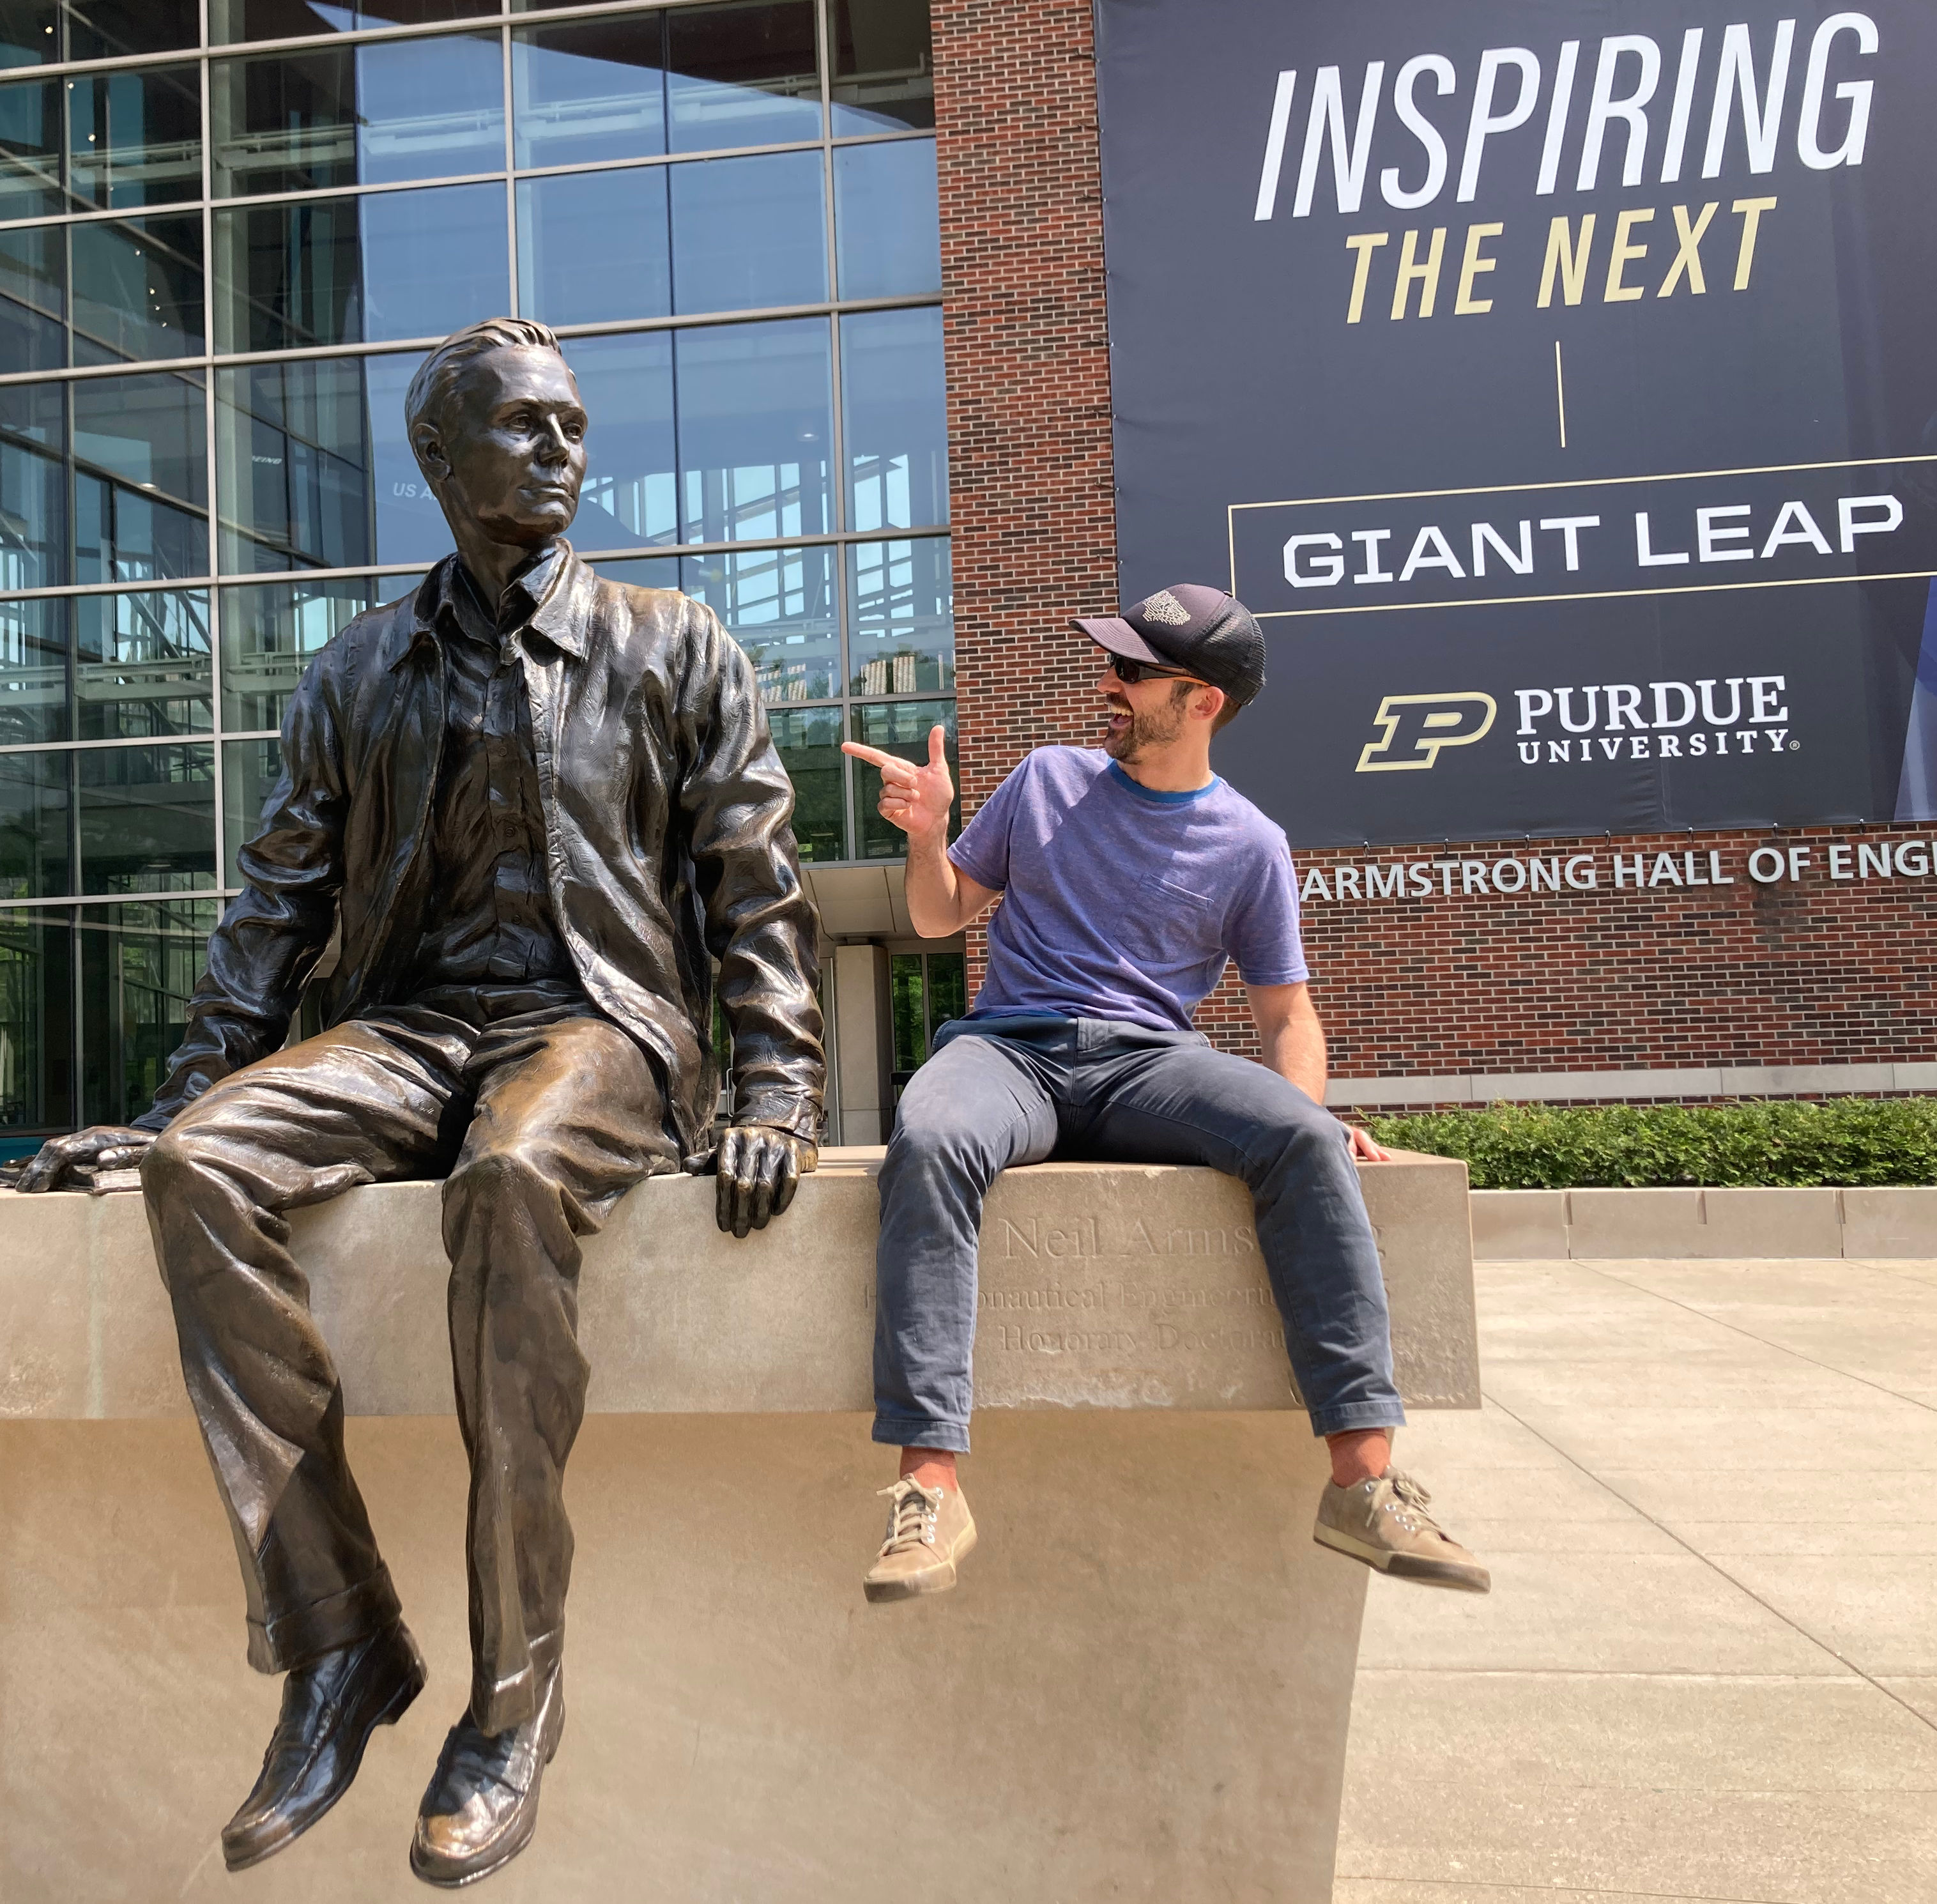
On Wednesday afternoon, I missed a few of the talks because I went to Purdue campus with a SEA scientist collaborator to meet with another collaborator there and discuss a project. That was a productive meeting, and it was also fun to wander around the campus and have my picture taken with the Neil Armstrong statue. Purdue hypes up their connection with Neil Armstrong — their branding slogan is even “Giant Leaps.” Pretty cool, though, I have to admit.
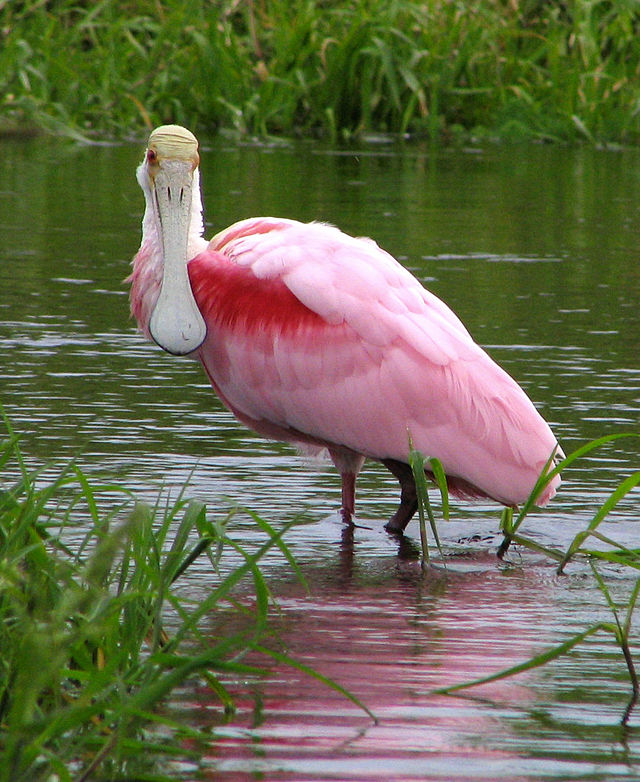
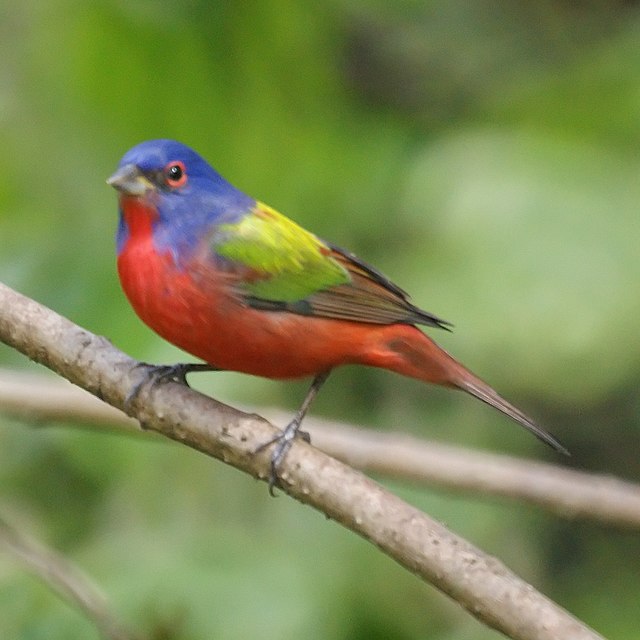
Aside from the conference, by far the best thing about my trip to West Lafayette was staying at a hotel that was literally across the road from Celery Bog. That is a natural area with a great mix of habitats including ponds, marshes, shrubby thickets, and woods. This makes it a magnet for migrating birds, and mid-May is right when the peak songbird migration hits the upper Midwest. I visited the bog five times in the just over three days I was there, and enjoyed some of the best birdwatching I have ever had. Over that time I saw twenty species of warbler including the beautiful bay-breasted, Blackburnian, mourning, magnolia, and redstart warblers. Not to mention you could not throw a rock without hitting a singing Baltimore Oriole or Rose-breasted Grosbeak (this is not condoning throwing rocks at birds)! I really leaned into the “Indiana ecotourism” aspect of the trip. Looking forward to more in the future!
]]>For science to have any use, it has to be open science. A critical component of open science is reproducibility: that means making all data and code available that are needed to reproduce statistical analysis. Ideally, this would be done from day one, with intermediate outputs being made publicly available before an “official” publication. That is usually not feasible, so at the very least, analyses in a published manuscript need to be reproducible by other researchers. It isn’t enough to put a glossy finished product out there and hope everyone else will take your word for it that the analyses underlying it are valid. And saying “code and data are available upon request” totally doesn’t cut the mustard. Who knows what will happen to your email contact information in the future? And who will make sure you still have the data ready at hand in a well-organized, documented, and accessible format when someone asks you for it?
The acronym FAIR is a list of principles to follow for scientific data and code to truly be open. FAIR stands for Findable, Accessible, Interoperable, and Reusable. These are useful guidelines for researchers when deciding how best to make their data and code available. FAIR stands for findable, accessible, interoperable, and reusable. Not worrying about the “interoperable” piece of it for now, data clearly needs to be put in a place where people can find it with a reasonable amount of effort, download it free of charge or other barriers, and put it to new uses.
I have been thinking about this for two reasons. First, the White House recently came out with a mandate to make all federally funded science immediately publicly available. A groan was heard from academic publishers everywhere. Nightmarish visions of fat 40% profit margins flying out the window appeared to executives at Wiley, Springer, and Elsevier. But making the science available does not just mean making the papers available. We also have to have all the code and data be available. Unfortunately, this is not as simple as it seems. Federal researchers work under a bunch of constraints. You cannot just throw stuff up on the cloud because there are (understandably) a lot of rules about data security. For instance, you have to guarantee that no data is stored on an overseas server. Obviously it is very commonplace for servers to be hosted on machinery that’s physically located anywhere in the world. For that reason and others, a lot of things that academic scientists can do without thinking twice cannot be done by federal researchers.
Another problem, unfortunately, is that there is some disconnect between federal scientists and the administrators that run the agencies. Policies are often not clearly communicated. I recently experienced this when I completed an analysis in collaboration with a USDA scientist for a manuscript that was about to be submitted for publication. Being a good employee, I asked whether it was allowable to publish code and data associated with the analysis. I wanted to put it on a permanent online repository and give it a “DOI,” or permanent link that anyone could use to access it and potentially reproduce our results on their own computer. These results have to do with using a technique called genomic selection in sugarcane. Genomic selection is a powerful tool for conventional breeding (basically the closest you can get to genetic engineering without actually modifying the DNA… a cross between traditional plant breeding methods and the new school). So it is something that could potentially be of interest to a lot of people. Unfortunately it wasn’t that simple. There are a lot of restrictions. It is a little bit of a double bind because we are encouraged to share our science, but we run up against the restriction that some of the modern tools, that are now considered open science best practices, are not available to us because it takes a long time for the federal government to approve things. People are afraid, justifiably, of breaking the rules so they feel the easiest way out is just not to share the data. In the end, I did manage to publish the code as a supplement to the paper, but this is a subpar solution compared to putting it on an online repository where it is fully documented and can be accessed on its own without the paper.
Luckily, after asking around about it a little bit, I found out that some folks at USDA have already been working on this. The National Agricultural Library has its own in-house data repository called Ag Data Commons, which USDA researchers can use to submit data and code to a permanent, stable online repository. Currently, everything still has to be done manually, but in the near future it will be integrated with the code-sharing platform GitHub so that users can automatically release new versions of their code to the stable repository when it is updated. I am very happy that the NAL is doing this important work. I have started to use this platform for other projects I’m working on, and I’m very appreciative of the hard work folks at NAL are putting in to help format and document everything according to the FAIR principles.
Overall, I think that USDA has a way to go to catch up with other government agencies like CDC, NOAA, and USGS that are doing a great job making their work available to the taxpayers that funded it, following the principles of open science. I’m hoping to help lead the effort to make USDA’s science more open, now and in the future!
]]>I am writing this in the midst of an early August heat wave, and against the backdrop of the excruciating wait for the United States Congress to enact meaningful policy on climate change. I have been suffering from an emotional rollercoaster, more than once giving the whole “climate deal” up for dead, only to receive another tantalizing bit of news about how another compromise or deal breathed new life into the spending package. Currently (August 4), it looks decently likely that a much-reduced incarnation of the climate bill will pass both houses of Congress, but I will keep worrying until it is a completely done deal. There are people actively working to derail it even as we speak. More about that later …
In terms of the summer heat, I have been gaslighting myself a little bit and questioning whether maybe it has always been “this hot” in the Southeastern United States in summer. I grew up in North Carolina and had a series of summer jobs surveying forests and doing other ecological field technician work, so I was fully exposed to the worst heat that NC could throw at me. Subsequently, I missed out on quite a few Southeastern summers in a row. First I spent a few years doing fieldwork in the Rocky Mountains during graduate school, and then I enjoyed beautifully mild summers in Michigan while I was postdocing at Michigan State. We moved next to Maryland, with its famous stiflingly humid summers … but they just don’t last quite as oppressively long as summers in North Carolina and points further south. We moved back to North Carolina in late September of 2021, again missing the majority of summer.
Long story short, 2022 is the first year since 2010 that I have spent the entire summer in North Carolina. Because of that, I could plausibly say to myself that maybe I just don’t remember how hot it gets in the summer here. (Apart from the fact that even if summer isn’t that much hotter in one specific place, it is undeniably getting hotter across all seasons globally.) But I have to say, climate change has progressed to the point where I can directly perceive hotter and longer summers, especially hotter nighttime temperatures, and all the uncomfortable and dangerous consequences those high temperatures entail.
Now for a more positive spin on the “summer in NC” theme of this post! I have been a big fan of birdwatching ever since I was a kid, and I give birding (and the people who introduced me to it) a lot of credit for my eventual decision to begin a career as a biologist. I haven’t traveled a ton with the explicit goal see birds, mostly opting to look for birds wherever I happen to be. Because of that, there are some birds that are fairly common in the “Deep South,” whose typical summer ranges extend well into southeastern North Carolina, that I have never seen. Excitingly, I was able to see a couple of those birds this month right here in Wake County (home of Raleigh).
The first few were wading birds that often venture a few hundred miles north of their typical haunts during summer. A local hotspot where they often turn up is a marsh at the edge of Lake Wheeler, a fairly big artificial lake south of Raleigh. A road crosses the lake on a causeway, and there is a small “peninsula” that juts out of the causeway where you can post up and observe marsh birds far across the water. They’re usually pretty far away to see well even with binoculars (8x to 10x magnification), but a few friendly birders let me look through their telescopes (45x to 60x magnification). First, a Glossy Ibis showed up, followed a few days later by a Wood Stork, then a Roseate Spoonbill! I was thrilled to see all of them. My three-year-old son even got some good looks at the Spoonbill when a Bald Eagle spooked it and it flew a few laps around the marsh before landing elsewhere.
After seeing those exciting birds at Lake Wheeler, I saw on the Wake County Rare Bird Alert page on eBird.org that a Painted Bunting had been seen at Dorothea Dix Park less than a mile from home! Our whole family rushed there and saw the bird, a colorful and jaunty male singing loudly from a prominently visible spot in the top of a small non-native elm tree. I have to use the term “magical” to describe the experience of seeing such a stunning living thing for the first time. The male’s colors are unparalleled, with a royal blue head, vivid red belly, and lime green back patch, and it has a cheerful, twittering song. We have been returning to see it again and again for the past three weeks, and the show shows no sign of stopping. The bird is very cooperative and spends a lot of time preening and singing on his favorite perches, flying back and forth between the same few trees. It has been fun to chat with the diverse crowd of people who have come to the park to take a look at the bird.
Why all this talk of birds? Well, while I have been enjoying the summer birdlife of Wake County, and while a few individuals of these southern species have been making their way this far north for many summers, it does make you think that maybe they are harbingers of change. Maybe these species are extending their ranges to the north because of warmer temperatures, and maybe in a few years it will be commonplace to see them in Wake County in the summer. In fact, a birder who I would guess is about my dad’s age was talking about a similar trend the other day while we were watching the marsh birds. A ragtag bunch of Fish Crows flew by, cawing nasally. The birder told us that when he was a kid growing up in Wake County, the only place to see Fish Crows was around the Neuse River in summer (closer to the Coastal Plain). Then they started appearing all around the county in warmer months, and now they even hang around in the winter too. I would like to say that I have noticed Fish Crows increasing in abundance too, but I think it is more that I only really realized how to tell their distinctive nasal cawing apart from an American Crow three or four years ago. Either way, they are getting more and more common around here, probably as a result of the warming climate.
So it’s been a thrill to see all these new birds, but foreboding about climate change is in the back of my mind as always. When (not if) the climate deal is finalized, I will have a little more reason for hope. Of course, I don’t think the climate deal really goes far enough. It is a good start for transforming our energy and transportation systems. But it largely ignores the food system, which is both a huge contributor to climate change and imperiled by it — with more heat waves and extreme weather, it will be harder and harder to sustain agriculture as we know it. I think I will save a fuller discussion of that for my next blog post.
Note: I do not have good enough camera equipment to get passable photos of the bunting, spoonbill, etc. There are many photos of them on the Wake County eBird media page, and the individual species pages for Wake County, for example Painted Bunting and Roseate Spoonbill. But I cannot legally repost those images on this blog so I have used public domain images of the birds, not pictures of the specific birds seen in Raleigh!
]]>Recently, my former postdoc mentor Mary Muth, my amazing colleague and collaborator Kelly Hondula, and I published a paper about xxx. Out of all the work I’ve done in my professional career so far, it’s the one I’m most excited about and proudest of. But not all the results turned out quite the way we expected — and we were lucky enough to get a smidgen of media attention for the work, which complicates the picture further.
Here’s a link to the actual paper in the journal PNAS as well as a really great two-page synopsis written by Felicia Keesing for PNAS. If you can’t access these because of a paywall, please email me and I will share them with you.
We put together a bunch of different models and data about food consumption in the United States and its environmental impact. First, we figured out how much land is used in each county of the United States, and each country around the world, to produce food that people in the United States consume. Because of our globalized food system and our ability as affluent consumers to purchase expensive imported food, a full 20% of the land used to produce food in the USA is actually in other countries. Next, we converted that land footprint into a biodiversity footprint: when land is converted from natural habitat to agricultural uses, it takes away resources that animals and plants need to sustain their own populations. Even if species don’t immediately go extinct when portions of their habitat are taken away, some species might not have enough land left to keep up a stable population size. So some of them might be “doomed” to eventual extinction if they don’t get some of that land back. We used a few different models … and a lot of assumptions … to get an estimate of the number of plant, mammal, bird, amphibian, and reptile species threatened in this way by Americans’ food consumption habits.
The next thing we did was run those baseline numbers through a few different scenarios. We imagined hypothetical situations where food waste was cut by 50% in the USA, meaning that Americans’ consumption habits could be sustained with less land. We also imagined that overnight, all Americans switched their diet to conform with either the Dietary Guidelines of the USDA and Dept. of Health and Human Services, or the Planetary Health diet recommended by the Lancet commission. What would the consequences of those changes be for the land and biodiversity threat footprint of the American diet?
You probably know the Dietary Guidelines from the old-school food pyramid, which has now been changed to “MyPlate.gov.” There are actually three recommended diets from those guidelines. One is called healthy US-style, one is healthy Mediterranean-style, and the third is healthy vegetarian. They aren’t explicitly supposed to be sustainable, but they are all supposed to be healthy. They all recommend eating less meat than Americans do now, and more fruit, veggies, and nuts. The veggie diet has plenty of animal products in the form of dairy and eggs, though, and the Med-style diet has a decent amount of seafood. By contrast, the Planetary Health diet is supposed to be both healthy and sustainable, with very little animal products in its daily allowance, but lots of fruit, grains, and nuts.
What did we find? Well, we found, unsurprisingly, that food consumption in the United States has a hefty land footprint both inside and outside the nation’s borders. The largest contributor to the land footprint is the pastureland used to raise beef and dairy cattle and farmland to grow the crops used to produce animal feed. However, even though permanent crops like fruit and nut trees occupy only a small fraction of the agricultural land used to produce Americans’ food, that land tends to be more intensively managed, which is more harmful to local biodiversity, and located in parts of the country and world that have higher biodiversity. This leads to a disproportionately high threat to biodiversity from those “specialty” crops, which include things like coffee and chocolate grown in the tropics and fruit and nuts from California, Florida, and Hawaii.
So far, that’s not a particularly new or groundbreaking result. The interesting spin we put on it is to combine this result with simulations of “alternate realities” where the USA takes steps to improve the health and sustainability of American diets. Again, two (if not the two) ways of doing that are to reduce food waste and to change the composition of the average American diet. When we ran those scenarios, we found that while the healthy diets that replace meat mostly with dairy and seafood (the US-style and Mediterranean-style diets) use somewhat less land overall, it actually would have negative consequences for biodiversity if every American ate according to those recommendations. This is because replacing animal products with other animal products does not really change much of the impact, as well as because those diets replace some of the meat and added sugars and fats with fruit and nuts. Those fruits and nuts have to be produced somewhere and if we assume it will require expanding the land footprint in high-biodiversity areas, that will be harmful to the populations of plants and animals that live there. Similarly, even the vegetarian and Planetary Health diets, while they would greatly reduce the land footprint of agriculture by using a lot less pastureland, would not reduce biodiversity threat by as much as you would think just from adding up the land totals. Again this is because of their high requirement of fruit and nuts to replace animal-based sources of nutrition.
However, the results still indicate clearly that plant-based diets are the way to go for reducing the harmful impacts of the USA’s food consumption on biodiversity. The other interesting result is just how well food waste reduction stacks up against these extreme diet changes (that most Americans would probably strongly resist). Cutting food waste in half, and assuming that reduction in demand would reduce food production, could take enough pressure off agricultural land to save X% of the species that are under threat of extinction from American food consumption. That’s a great bang for your buck, especially when you consider that switching everyone in the USA to a vegetarian or Planetary Health diet would reduce that same threat by X%. That isn’t that much more for something that would be incredibly difficult to do — even the mere suggestion of the Planetary Health diet provoked a gigantic backlash when it was proposed. By a similar token, if we wanted to shift our average diet to a healthier (but not as hated by the meat and dairy industries) one that has a little bit worse of an impact on biodiversity, we could more than offset that impact by cutting food waste in half. That’s really important because that would mean overcoming the unfortunate need to choose between what’s healthy for ourselves and for the planet.
We were lucky enough to get a little bit of media attention for this paper. I know it’s silly to chase publications in high-profile journals but I guess that is the point: a few of those journals do get looked at by people outside the ivory tower. We even got a brief blurb in the weekly science news column in La Presse, Montreal’s daily paper (link in French only!) I thought it was interesting how they chose to portray the results. The headline proclaims “Mediterranean Diet Bad For Biodiversity” (!) I guess I don’t completely disagree with that but it was a little surprising that that was the result the journalist chose to focus on. I tried to put a more positive spin on things in the actual paper, focusing on potential benefits of actions society could take. But the headline is certainly not incorrect based on the results we got. Well, the only quibble is that the diet in the dietary guidelines is called Mediterranean-style, not just Mediterranean. That’s probably because it includes a good amount more dairy and red meat than what is typically thought of as a true Mediterranean diet with more grains and fish. But that speaks to the different ways in which the creators of the dietary guidelines are pulled, because of the different mandates of the USDA and DHHS. It’s hard to satisfy sustainability, health, and the profitability of agriculture all at the same time.
I can’t complain because not that many scientific papers get any attention at all outside of the academic literature. At first I felt a little uncomfortable that the work was being used to say that healthy diets might not be good for biodiversity, but I think it’s important to stand by the results you get whether or not they support your prior beliefs or agenda. At least, that’s the ideal of objectivity that scientists always brag about but don’t actually live up to that often. At the end of the day, we did show that plant-based diets are beneficial for biodiversity, just not quite in proportion to the amount of land they could spare. It really points more to the need to consider the sources of calories in any diet and source them more intelligently. Biodiversity is unequally distributed across the globe so it makes sense for us to prioritize our food consumption to avoid overexploiting the most biodiversity-rich places and minimize the impact on biodiversity. And of course food waste reduction can help make that task a bit easier.
By the way the paper also got a longer write-up in Anthropocene Magazine which you might be interested in.
]]>Earlier this month I wrote a post about starting to work for the Ag Research Service, part of the US Department of Agriculture. In that post, I talked about trying to use agricultural research to promote sustainability and climate resilience of the food system. This time, I’m going to talk about my other long-term goal at USDA: changing the way we analyze data and talk about evidence. That might seem a little technical or even trivial, but I think it has the potential to change the way scientists think about reality and to create a more honest and collaborative scientific enterprise.
My goal is to get USDA scientists to move away from the old paradigm of yes-or-no answers to statistical questions. For historically obscure reasons, the number 95% was enshrined as the gold standard for whether a phenomenon you observe is “real” or not. In other words, if we are 95% (or more) confident that, let’s say, a drug reduces cancer rate in lab rats, or a new crop rotation technique increases corn yield, or whatever, we can say “drug x causes significant reduction in cancer” or “new crop rotation significantly increases corn yield,” but if we are only 94% confident based on our data, we can’t say that. You might have heard the term “p-value” or “p < 0.05.” The 0.05 is derived from the goal of achieving 95% confidence (1 - 0.95 = 0.05). The p-value is a number that you can calculate using a set of data, which tells you the probability that you could have observed that set of data if your hypothesis wasn’t true. For example if you think a drug reduces the chance of getting cancer, and you see that 30% of rats that got a placebo get cancer, but only 20% of rats that got the drug get cancer, one of two things could be true. Either the drug really does reduce the chance of getting cancer (your hypothesis), or the drug does nothing and the difference you observed in cancer rate was just a lucky result (the so-called null hypothesis). If the null hypothesis were true, in your one particular study, the cards just happened to fall in your favor, but if you did it again they might well not. The p-value helps estimate the chance that you could have gotten at least the difference between drug and placebo you did, or better, if the drug actually were useless. The lower the p-value, the more confident we can be that our results were not a one-time fluke caused by chance, making us more confident that the null hypothesis isn’t true.
Sounds good so far, right? Well, in contrast to some people, I have nothing against p-values, they are a very useful tool. The problem arises with the artificial threshold of p < 0.05. The current practice across much of science is to say a result is “significant,” meaning we have significant confidence to say the null hypothesis isn’t true, if p < 0.05. If it is any higher than that, even 0.051, we can’t. This is an illogical and absurd way of doing science. There’s no such thing, in reality, as a black-and-white distinction between “yes it has an effect” and “no it doesn’t.” And even if there were, why should it be 0.05 for every possible phenomenon in the world, from cancer drugs to climate change to social relationships of chimpanzees?
The problem isn’t just that the 0.05 (or 95%) cutoff is arbitrary. Because publishing your scientific study is more likely when you have a “significant” result (“significant” is the official word for 95% or greater confidence), scientists are incentivized to fiddle around with their statistical analyses until they get something 95% or greater, then only publish those results. This leads to a lot of spurious results getting published. There are many ways to analyze a single dataset. You can often get p < 0.05 by trying out a bunch of ways until you reach that magic number, a practice known as p-hacking. Worse, the incentive to only publish significant results leads to people effectively discarding lots of interesting data that can’t be forced to produce 95% confidence so that no one can use and learn from it. This has led to a situation called the “reproducibility crisis.” Because many published scientific results bear the fingerprints of p-hacking and the bias toward publishing significant results only, they do not accurately reflect how confident we are that a phenomenon is real. So if someone else does another study to try to reproduce the same phenomenon in a different context, they often can’t. Using the term crisis is no exaggeration — if a scientific result can’t be repeated, it can’t be applied to a new purpose or used to benefit humanity in any way.
So much for the problem. What about solutions? There are a couple of things I’m trying to do. First, the concept of p-values comes from a kind of statistics called “frequentist.” The alternative is called “Bayesian.” With all due respect to Reverend Thomas Bayes, “Bayesian” isn’t the best name for it because it doesn’t tell you anything about what Bayesian inference is. In my opinion, Bayesian inference has two big advantages over frequentist. First, Bayesian analysis has a built-in way to include your prior knowledge in the analysis. Instead of always being forced to go with a null hypothesis that “X is not true at all,” we can input into the model our prior beliefs about what possibilities are the most plausible. Second, it naturally describes our uncertainty about phenomena and the strength of evidence for and against them in a more continuous way. Instead of talking in black-and-white, yes-or-no terms (is there an effect or isn’t there?), we can give more honest descriptions of the size of the effect and what we think plausible upper and lower limits are for that size. I think that’s asking the right question because everything in the universe has some effect on everything else, so the best we can do is say, based on our knowledge and the data, what is the range of outcomes most likely to be true.
I am not an unquestioning disciple of Bayesian statistics who refuses to use any other method, but I’m trying to move the needle a little bit. Many scientists are unaware of how to do Bayesian statistics because in the past, it was really hard to actually put it into practice. So they’re a little scared of it to be honest. Nowadays, thanks to a few hard-working people that I am incredibly indebted to12, there are freely available and easily implemented ways to do Bayesian stats. So I’m introducing it little by little to USDA scientists and encouraging them to do Bayesian stats, or at least to use more honest and continuous language about evidence in their papers. But there is some resistance mainly because people are worried their papers won’t get published unless they use the word “significant.” But I think acceptance of the less artificially black-and-white language about uncertainty and evidence is growing. Scientists are moving away from the old yes-or-no paradigm and being more honest — at least I think so on optimistic days!
All of this is also tied into another issue, which is the openness and availability of data and methods. It’s easier to engage in p-hacking and be obscure about how you got to your conclusions if people cannot access the data and computer code that you used, and try it out for themselves to see how you achieved your results. So another thing I’m trying to do at USDA is to make sure all the studies I’m part of have data and code that are out there somewhere on a server that people can freely download. That’s a critical piece of the puzzle. I could write a whole bunch more about that, and I probably will because this blog post is already probably too long and didactic.
If you’ve read this far in the post, thanks! I want to just quickly set the record straight that I am by no means the only person in the Ag Research Service working to change the narratives about statistical evidence and increase the openness and reproducibility of science, nor am I immune from any of the bad practices I discussed above. I am guilty of p-hacking and searching for significant results too. But it’s important to recognize that this is a journey — ideally, with every project you do, you learn a little bit more and get a little bit better at doing it right. Also, Bayesian stats are not a panacea. On their own they don’t prevent people from manipulating stats and data to get a good-looking but untrue result. But I think it is a really important step in the direction that science needs to go.
Stan software, originally created by Andrew Gelman and maintained by a team of dedicated folks, is a great tool. ↩
The brms R software package created by Paul Bürkner is another incredibly useful tool that I use every day. ↩
First of all, what exactly am I doing? My official job title is “Southeast Area Statistician.” That means I am responsible for the Southeast area, which includes North Carolina, Tennessee, South Carolina, Georgia, Florida, Alabama, Mississippi, Louisiana, Arkansas, and Puerto Rico. I have counterparts in the Northeast, Pacific West, Midwest, and Great Plains. There are four or five hundred scientists working for ARS in the Southeast area that I’m responsible for. Actually, that number just includes the P.I.s that lead labs. There are also a bunch of postdocs, techs, and students that work with them. Any of those people could contact me and ask me to help them with stats and data. That help could range from a 20-minute conversation to a collaboration lasting months.
Over the past six months, I have been working on all kinds of different projects. Just a few: testing different essential oil extracts to trap crop-damaging flies, using topography to predict soil moisture in pecan groves, using genomic data to predict which sugarcane varieties have the best traits and should be used in breeding programs, studying the effects of cover crops and rotations on crop output and disease resistance, developing a system to rate sweet potatoes for insect damage, and crossing soybean crops with their wild relatives to improve their traits. And those are just a few of the dozens of projects I’m contributing to.
I have two main long-term goals with USDA. The first, and most important, is to help improve the sustainability and climate resilience of agriculture in the United States, and by extension, of the global food system. The second is to reshape the way science, in particular how we analyze and interpret data, is done at USDA. In this post, I’m going to talk about the first one, and in a later post I will talk about the second one.
So let’s talk a little about the sustainability and resilience of agriculture in the United States. It’s clear that we could be doing a better job of balancing feeding the world in the short term and protecting the natural environment that sustains us and all other living things in the long term. That job is only going to get harder as the climate becomes less benign and more extreme, making it harder to reliably produce food. We have lots of technology and infrastructure to produce abundant food, but it comes at a high environmental cost and we do a poor job of getting that food to the people who need it.
I have been inspired so far by the research being done at USDA to make agriculture more sustainable, with a lower environmental impact, as well as to develop crops and techniques that will be resilient to negative human-caused changes in the climate. I think it’s important to support that research in any way possible. That’s because reducing agriculture’s land and resource footprint, and making sure that we can continue to feed everyone even as climate change makes it harder to support agriculture, are both really time-sensitive. We have to fix those problems now.
While the scientists and other folks that work at ARS are contributing to fixing these huge problems, it’s far from perfect: the USDA also has a mandate to promote the profitability of U.S. agriculture. I’m a strong advocate for plant-based diets, as you may have noticed from previous posts on this blog, but USDA is heavily involved in animal agriculture. ARS is no exception. So that’s definitely a complex issue. In addition, a good amount of the research at ARS is focused on increasing yield, or the efficiency of how much food is produced per unit land area. This often comes at the cost of requiring a lot bigger input of chemicals and fossil fuels to wring higher yield out of that piece of land. I think that it’s critical to try to achieve those yield improvements, to benefit both agricultural productivity itself and conservation goals: if we can increase yields on the land we have already converted to agriculture, we can continue to set aside land where ecosystems and communities of organisms can persist and provide beneficial sevices. But I think we also need to consider whether those yield improvements are worth whatever additional inputs are needed to maintain that increased yield. Agricultural research, and the policy it helps drive, has to face those kind of difficult trade-offs.
I am still considering it deeply, but I do believe that the global agricultural-industrial complex, with all its benefits and flaws, is not going to disappear overnight. We desperately need to make change from within, and I think the research at ARS is a critical part of that. It sounds trite but I think that working at ARS is an important way for me to serve my country and effect positive global change.
]]>I can’t believe it’s been two and a half years since I wrote a blog post! Well, maybe the fact that we have a kid slightly over two and a half years old has something to do with that. To all my readers out there (all five of you), sorry to keep you in excited anticipation for so long for my next gem of a blog post to drop. Full disclosure: I did write a few entries on the now-moribund SESYNC data scientists’ “cyber blog” during that time. But now I’ve left SESYNC and Maryland and have a new job as a statistician for the USDA’s Agricultural Research Service, with an office on the edge of NC State’s campus in Raleigh, North Carolina. So in future blog posts I might start to write more about my new foray into the world of ag stats.
Speaking of SESYNC, this short post is inspired by a paper in Nature I just read that came out of a SESYNC working group, an interdisciplinary team of a dozen or so people from different fields of academia, as well as government and the private sector, who convene to tackle a particular social-environmental problem. The team I was on was working on food waste, but the team who wrote this paper tackled a real thorny question: how does human behavior interact with climate change? This is incredibly important for us to understand because most of our climate models are really physical models that assume that people are out there doing their thing and having a certain impact on the physical environment. This might cause the environment to change, but the models don’t really capture any “feedbacks” where environmental change causes people to change their behavior, or the impacts people have on each other to influence each other’s behavior. That’s clearly got to be a huge factor.
Anyway, I try to keep abreast of the scientific literature. Because of my dilettantish nature, I have dabbled in a lot of fields in my short career so far. So now, to stay current in all those fields, I have to keep up with any new developments in ecology, environmental science, food-system economics, data science, and statistics … it’s exhausting! I read (OK, skim) a good number of papers every few weeks. I enjoy learning about new things but rarely get emotionally invested in the papers. But when reading this paper I found myself saying things like “That’s right!” and “F__k yeah it does!” So I felt I had to write down my reactions.
The basic point of the paper (as I understood it) is that there are really complicated interactions between the human social system and the physical environment. For instance, climate change might cause increases in extreme weather events, which might cause some people to experience climate change more immediately, which in turn might cause them to change their behavior or implement different policies, which comes back around and affects the climate. Or alternatively, climate change might change the baseline of what people perceive as “normal weather,” desensitizing people to ongoing climate change, which might decrease the likelihood of new policies that will mitigate climate change. I’m talking about it in a very hand-wavey way, but the authors of the paper did a bunch of really neat modeling to get very concrete predictions about these things.
The section of the paper that I found the most inspiring discussed feedbacks from individuals choosing to engage in pro-environmental behaviors that reduce carbon emissions. While the effect of an individual changing his or her behavior is small, the real benefit comes when other people observe that behavior. That causes some of them to change their own behavior. Of course, it’s not always known exactly how strong that “peer pressure” effect is, or how it might vary from place to place or in different contexts. But the modelers tested out a whole range of assumptions of the strength of the effect that people’s decisions to reduce their individual carbon emissions have on their peers’ later decisions to do the same thing. And it turns out that even if the effect is pretty modest, it can lead to self-reinforcing patterns or tipping points. That can actually have a significant effect on total carbon emissions, with positive consequences for the climate.
That result inspired me because I believe strongly that, although we need to seek top-down policy solutions first and foremost, it’s really important to do everything we as individuals can to bring our own actions in line with what we believe to be the right thing to do (see this older blog post). It is critical that we can feel that we are doing our part to create the future we want. So I was excited to see that cutting-edge social-environmental modeling supports that as not only a noble ideal but also something that can make a tangible difference. Of course, a model is just a model, which is a hypothesis about how things will actually work in reality, but models can be really useful to give people something concrete to frame a problem in their minds.
Also, when I read the paper, I had just been looking at Take the Jump which is encouraging people, specifically people like me from wealthy countries, to take six concrete steps to reduce materialism and thereby their carbon footprint. They are trying to get people to sign up to this, if not permanently, then at least for a few months in a kind of “Lenten vow.” Their thing is to bring “joy” back to the green movement. They specifically encourage people to avoid the “us vs. them” mentality and not to shame others for not making the same decisions. That really fits in with the results from the Nature paper — shaming can be counterproductive, but there is good reason to believe that simply leading by example can help us get closer to the positive tipping points we need to have any hope of fending off the worst impacts of the climate crisis.
Thanks for reading! I hope my next blog post will be less than 2.5 years from now. …
]]>First of all I apologize for the long silence in between blog posts. I have a lot of different topics I’m planning to blog about in the near future. Since I last wrote a blog entry, we’ve welcomed a new arrival to our family, a baby boy born on July 3. As you can imagine, blogging has slipped through the cracks a little bit. I hope a few more will follow after this.
Along with a fellow postdoc, I have been working on a project investigating patterns of how rainforest trees divide up light energy. I am not the first author but I’ve been working on the data processing, analysis, and statistics for the project for about 3 years now. I’ll give a brief idea of what the paper is about: Trees are constantly struggling to get as much light as they can to fuel photosynthesis. The more light energy they get, the taller they can grow and the more light they can deny their neighbors. Eventually, if a tree has enough light energy, it invests some of it into producing flowers, fruit, and seeds, and ultimately offspring. So it’s clear that in places where other resources like water and soil nutrients are adequate, the species of trees that get the most light are going to be the ones that become the most abundant.
The picture is a little more complex than that, though. There are actually a number of different “life strategies” a tree can pursue that are good enough, in an evolutionary sense, for species with those strategies to survive and prosper. There are some kinds of trees that grow extremely quickly in light gaps created when large trees are felled by things like lightning or windstorms. However, the breakneck pace those trees grow comes at a cost: they die at relatively young ages and cannot survive at all in dimmer, shadier spots. In contrast, other species of trees can survive for a long time in dim, shady places, but this conservative lifestyle means that their growth maxes out at a relatively slow rate. As a third strategy, there are also trees that are intermediate in their growth rate and survival rate but can grow to immense sizes – these end up being the “canopy giants” of the rainforest in Panama that we are studying. However, those giants cannot produce any offspring until they are quite large. The fourth strategy is the opposite pole to the giants: trees that grow only to a short, shrublike size but can produce lots of seeds and offspring while they are still relatively small.
The paper we’re writing tells a complete story that links these different tree life strategies with broad ecological theories that explain how organisms’ growth rates and energy consumption rates scale with size. We explain how energy is divided evenly among size classes of trees in the rainforest, even though it would seem like big trees should hog all the light. I’m excited about this paper but I don’t want to give too many more spoilers. What I really wanted to write about here is a mistake we found in the analysis, and the consequences of it.
About a week ago, one of the co-authors on the paper, who has done a lot of work with tropical trees and who is very familiar with the system, noticed that some of our graphs looked weird. After delving into the problem, we realized that due to some errors in data processing, we had excluded a large number of small sapling trees from the dataset. That exclusion had caused a bizarre-looking pattern where there were fewer small trees than expected from the scaling relationship we fit. We had come up with various explanations for the anomaly, not to mention Frankensteining together a piecewise statistical distribution that would fit the funny-shaped curve caused by the anomaly. Imagine our surprise when we realized that we had simply been leaving out a large portion of the data throughout three years of analysis!
After smacking my head on the desk for a minute or two and bemoaning my stupidity, I moved on to fix the mistake. I am happy that we discovered the mistake. Here are a few lessons I’m taking away from it:
All science has mistakes. It’s likely that if we had published our findings earlier, that error would have made it into the final version of the article (if it wasn’t detected by an eagle-eyed reviewer). I am sure that almost all my other scientific research, and probably any other research that is sufficiently complex, has some kind of mistake in it, whether large or small. Anything that is exploring new dimensions of knowledge and trying out new ways of understanding the world is almost by definition more prone to errors — but that is exactly what is so exciting about it.
Show your data to someone who’s been there. Second, the fact that someone who had a lot of experience studying tropical rainforests on the ground discovered the mistake is no coincidence. That made me realize once again that even though analyzing data is great, and the skill set needed to work with big ecological datasets is essential these days, we can’t discount the expertise gained by working in the field. It’s a recipe for disaster to have a team composed only of theorists and data analysts without including people that have “been there” and can quickly and intuitively notice things that don’t look right when you plot the data.
Mistakes in science are, or at least should be, opportunities. Finally, getting rid of the mistake greatly simplifies the “story” of the paper — we can now eliminate the ad hoc explanations for the anomaly, and we can get rid of the jury-rigged stats we had to use to fit the data before. Also, we are using this opportunity to add new data to our analysis: previously we had assumed that the relationship between tree diameter and tree crown size was the same for all species, but now we can add in species-level relationships. We hadn’t done that before because I didn’t feel like rerunning all the models to make that change. Now that we have to rerun everything anyway, it’s a good chance to make a lot of improvements. Also, the fact that we thought there was an anomaly for so long caused me to learn a lot of additional statistics that will benefit my future research.
Thanks to Tom for inspiring me to write this post.
]]>Before I started working on food waste, I wasn’t aware of the ERS — the Economic Research Service, part of the U.S. Department of Agriculture. ERS produces and maintains a lot of different datasets that are essential to my current research, including data on food availability and food loss in production, distribution, and consumption, data on expenditures and revenue of farms and agricultural operations in the United States, models and data to help determine who benefits from the money Americans spend on food, and many more. The economists and other researchers that work for ERS are loyally serving the interests of the American public, but one thing they haven’t been especially good at is telling Trump and his lackeys what they want to hear. The administration perceives them as having a liberal bias — essentially because they produced evaluations and projections that suggest that some proposed administration policies would be a bad idea for U.S. farmers and the U.S. economy in general. So they have had a target on their backs for some time now.
About a year ago, the current Secretary of Agriculture, Sonny Perdue, announced that about 2/3 of the 300 ERS staff (along with NIFA, the National Institute of Food and Agriculture) would be relocated outside of Washington, D.C. A smaller number of ERS staff working on less controversial topics would be permitted to remain. Supposedly the relocation would bring them closer to their stakeholders. This was a nakedly political move: first because it clearly is aimed at diluting the influence of ERS, and second because it sends the message that the stakeholders that matter are big red-state agribusiness interests and their financial backers. After a reality-show-like bidding process in which cities and states competed to become the new home of ERS, the list is now narrowed down to three places: Kansas City, Research Triangle Park in NC, and Purdue University in Indiana. A final announcement is due any day now, prompting me to write this blog post.
The relocation of ERS is symptomatic of a larger trend of diminishing resources and support for publicly funded research in the United States. In order to solve deep-seated societal problems, it is crucial that researchers be allowed to produce data and results that are not funded by private interests, or whose priorities are not set by ideology of the currently prevailing administration. Research is increasingly seen as a luxury rather than a societal need. Research of the kind done by ERS, with fairly clear practical applications, is probably even better off in that respect than basic research. Even though relocating the ERS does not necessarily spell the end for critical economic research and data collection being done within USDA, it is certainly something that I and others view with unease.
The saga of ERS’s relocation is not yet over. A few weeks ago, ERS employees overwhelmingly voted to unionize, hoping to protect themselves amid the upheaval. And there is still the possibility that the move will be blocked at the eleventh hour, so Perdue is trying to railroad it through as fast as possible. Regardless of the outcome, the trend of drowning academic freedom and research produced in the public’s interest continues.
]]>If you read my previous blog post, you won’t be surprised to find out that a lot of the social media posts about Stop Food Waste Day are encouraging individuals to change their behavior to reduce household food waste. These efforts are crucial. Individual choice can go a long way toward reducing food waste. However, as long as the true price of food is not reflected in what we pay for food, society as a whole will continue to value food too cheaply and continue to waste it at a high rate.
What do I mean by the “true price of food?” I mean a price that includes the cost of all the environmental impacts generated in the production and the consumption of that food. A recent report by the Ellen MacArthur Foundation suggests that society incurs a cost of $2 for each $1 spent on food. That suggests that food only costs 1/3 as much as it should. Breaking down the $2 in societal cost, about half of that is related to consumption, whether overconsumption (obesity) or underconsumption (hunger). The other half is the impact of production. The foundation report divides this into health, economic, and environmental effects, although the three are interrelated. Environmental scientists and economists use the term “externality” to refer to a cost that is caused by some activity but is paid not by the person who did the activity but by society. In the case of food, a negative externality related to health would be, for example, that the health costs of treating adult-onset diabetes are not paid by the manufacturers of sugary foods that contribute to diabetes. Externalities can also be positive — for example, a fruit orchard could beautify the countryside or provide nectar for bees that pollinate other crops nearby. Unfortunately, however, it appears that in our current food system the negative externalities outweigh the positive.
Our current work is focusing especially on the environmental piece of the pie in the picture above. Piggybacking off work being done at the U.S. Environmental Protection Agency and the Department of Agriculture, we are working on models that will first determine the environmental impacts caused by the entire food system in the United States. This requires us to look at the externalities at each stage of the food supply chain, from farm to fork. Let’s take greenhouse gas emissions as an example. As food goes through the supply chain, activities involved with producing, processing, distributing, and transporting it release carbon dioxide and other gases that cause global warming into the atmosphere.
The image here shows wheat being made into spaghetti as an example. At the agricultural production stage, farm equipment burns fuel and releases greenhouse gas. The factory where the noodles are made releases more carbon dioxide. Distributors release even more when they truck the packaged product to stores, and consumers do too when they transport and cook the food. The total amount of greenhouse gas released increases as the food moves through the supply chain. You could say that spaghetti “virtually” represents a higher and higher amount of environmental impact, the further along the supply chain it progresses. In all cases, the greenhouse gas released is a negative externality because it harms us all by contributing to global warming, but isn’t included in the cost of the noodles. But the good thing is, if we can reduce waste at any one stage of the supply chain, we could get the positive effects of the waste reduction to trickle back up the chain and ultimately reduce the total environmental impact of the whole process.
We also need to know how much of the environmental impact caused by the food system can be traced back to food that is ultimately wasted. The rate of waste is different both across the different stages of the process and across different types of food. I made this (cute!) figure using data from a report on food waste from the United Nations Food and Agriculture Organization (FAO). The steeper the lines go down, the bigger proportion of food is wasted for that stage and for that type of food. We’re going to use those numbers, or similar ones, to determine the overall amount of food currently wasted, which will let us figure out how much of the environmental impact we could potentially reduce by reducing food waste.
Once we have the baseline environmental footprint and the baseline rate of food waste, we are going to develop different scenarios representing different potential actions society could take to reduce waste at different stages of the production and consumption process. For each scenario, we will look at the changes in the environmental footprint for greenhouse gases and a number of other categories. We can use that information to rank different alternative solutions to the food waste problem, which will help guide society to take the correct action.
There’s a surefire way to get people to be more efficient and waste less of the food they buy, and thus a surefire solution to reducing food waste. That is to make food more expensive — to include some of those harmful externalities in its cost. But it is clear that if many people in both developed and developing countries already cannot afford enough to eat or can only afford a poor diet of unhealthy food, we cannot simply increase the cost of food by 200% and direct the surplus toward solving the problems caused by food production and consumption. The FAO, in another recent report called “The future of food and agriculture: Alternative pathways to 2050,” does not dance around that issue. In the report, they state that any pathway to a sustainable food system must be accompanied by a more equitable distribution of income both within individual countries and worldwide. That’s a tough challenge for Stop Food Waste Day and for every day.
]]>